MarineFlow

Real-time monitoring · analytics · live AIS feed

Watch the world's ships in real time. Understand them over time.

MarineFlow ingests every ship position broadcast worldwide. A monitoring layer shows traffic, alerts and the health of the pipeline itself within seconds; an analytics layer turns the same stream into hourly vessel activity, port traffic and a 30-day risk score.

One stream, two layers

Monitoring layer · real time

See the fleet and the pipeline as it happens

Spark Structured Streaming cleans every position within seconds. Grafana shows live traffic on a map, the alerts being raised, throughput per Kafka topic and the health of each job. A stateful Spark job compares every position with the previous one and publishes an alert on vessel-alerts when a ship jumps, accelerates absurdly or goes silent: Kafka to Kafka, with no warehouse in the way.

  • Four Grafana dashboards, generated from code
  • Per-vessel state: applyInPandasWithState
  • Monitors the pipeline too: Kafka, Spark, JVM
Analytics layer · hourly

Understand behaviour over time

The same positions are archived as Parquet in Google Cloud Storage, read through BigQuery external tables and modelled by dbt into seven gold tables: vessel activity, port traffic, dark events, speed anomalies, loitering, erratic course and a 30-day risk score. Airflow runs it every hour.

  • Bronze → Silver → Gold (medallion)
  • Incremental merges with surrogate keys
  • 104 dbt data tests after each run

The monitoring layer

Four Grafana dashboards, provisioned from code. They watch the ships and, just as importantly, the pipeline that watches the ships. Captured from the running stack by site/tools/capture_shots.mjs; the MMSI column of the alerts table is blurred.

The Kafka dashboard compares each raw topic with its Bronze counterpart instead of showing consumer-group lag: Spark does not commit its offsets to Kafka, so a lag panel would always be empty.

Architecture

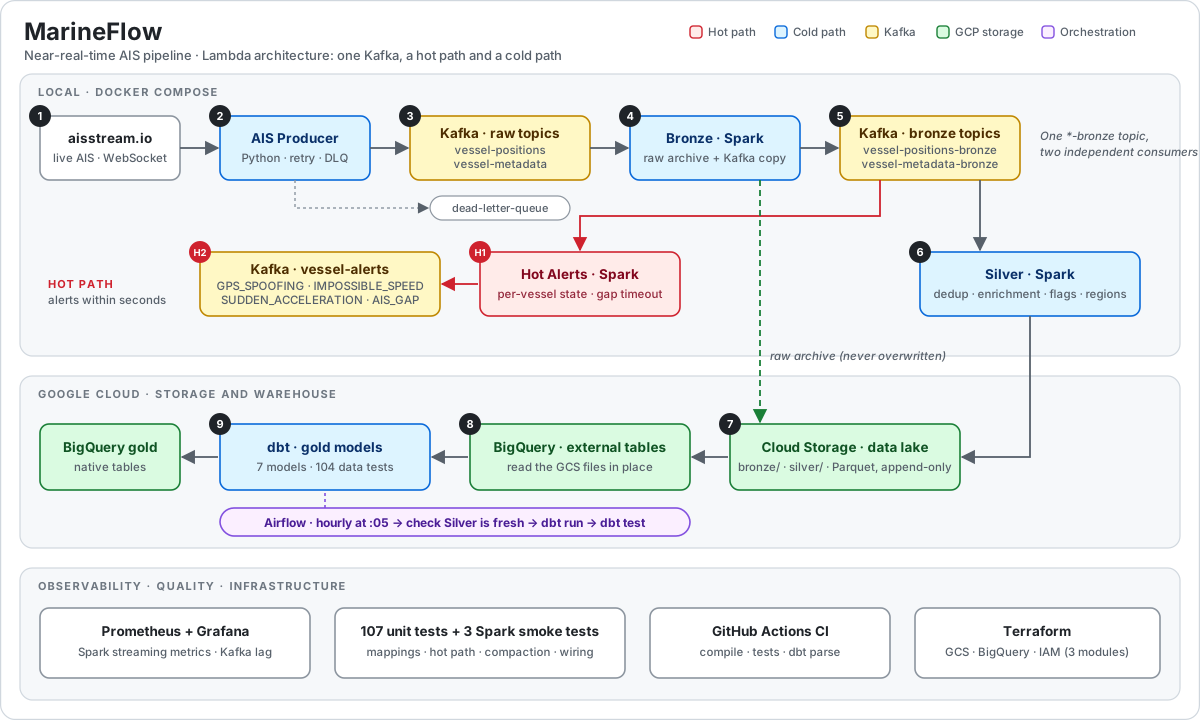
Everything runs locally in Docker Compose except storage and the warehouse, which are real Google Cloud services provisioned with Terraform.

Architecture diagram: producer, Kafka, hot path and cold path, GCS, BigQuery, dbt, Airflow, monitoring
14Docker services
6Kafka topics
5Spark streaming jobs
7gold models
9Airflow tasks

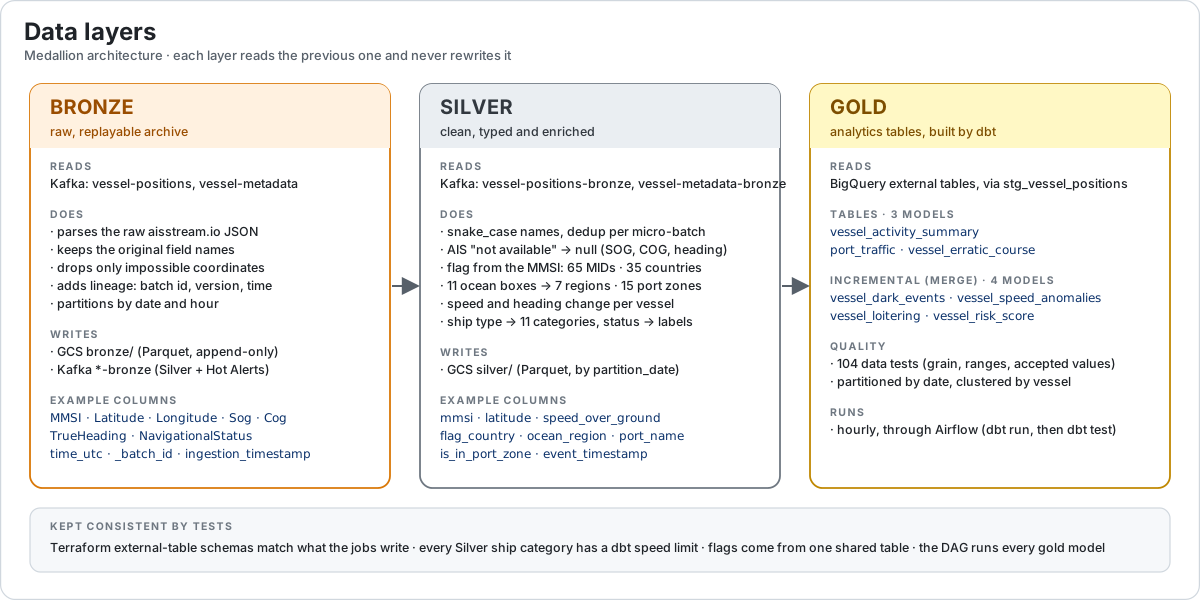
The medallion layers

Bronze, silver and gold layers and what each one adds

The analytics layer

Real numbers, read from the project's BigQuery tables by site/tools/refresh_data.py. Vessels are shown without names and with the MMSI masked.

Traffic density 2° cells, Silver positions

No coastline is drawn: the ships draw it. In this snapshot the brightest cell is the Dutch coast around Rotterdam, followed by the German Bight and the Baltic approaches, Puget Sound, the Gulf of Athens and the US Gulf coast.

Ingestion positions per 5 minutes

A continuous run of the live feed, about 5,000 positions a minute, with three gaps (29, 3 and 4 minutes) where the stack was restarted. Before the Docker VM was given more memory the Spark jobs were killed more than once; see limits.

Distinct vessels by flag top 10, from the MMSI country code

Vessel types gold activity summary

Where the ships were positions by ocean region

Port traffic gold, one day, inside the 15 monitored port zones

Risk score built for a 30-day window; here it covers the hours of this run

A pipeline output, not an accusation. The score is dominated by the speed-anomaly detector, and an anomaly can come from the data instead of the ship, which is exactly why the next section matters.

The hourly run Airflow, nine tasks

The staging view is rebuilt first, then four models run in parallel, the erratic-course and risk-score models follow, and the dbt tests close the run.

Case file: one identifier, two places at once

The single fastest “impossible speed” the pipeline flagged in this run. Names are left out on purpose.

Design decisions worth explaining

A compaction that cannot lose data

The first version read a Silver partition and overwrote the same path. Measured in the Spark image: 6 files and 600 rows became 0 and 0, while a catch-all except reported a warning. It was removed.

The replacement snapshots the partition, stages the result outside the table prefix, verifies it, commits through a manifest, and rolls forward after a crash. Late files are never read or deleted.

Tests that check the seams

Most bugs here were not inside a layer but between two. So the tests compare layers: Terraform external-table schemas against what the Spark jobs write, the DAG against the dbt models, Compose against the variables the code reads, and the README's numbers against the repository.

The smoke tests run on real Spark, because a fake had hidden a crash that only real Spark produced.

Dashboards as code

The four Grafana dashboards are generated by one stdlib-only Python script and committed as JSON. A unit test fails if the JSON drifts from the generator, if a panel points at a datasource that is not provisioned, or if a cluster-wide query leaks Kafka's internal __consumer_offsets topic.

Bugs found while building it

ProblemHow it was foundFix
Five gold models failed at once with Name nearest_port not foundThe first end-to-end run. dbt never rebuilds a view that is only referenced, so a renamed Silver column left a stale staging viewA dbt_staging task before every model
A tile called “Bronze rejects” showed 56–80%Sampling 3,000 raw messages: none failed validation. Docker showed the Bronze job OOMKilledRenamed to “Bronze gap”; described as a lag symptom
Hot Alerts crashed on the second position of any vesselThe real-Spark smoke test; Spark hands state over as a tuple, which a fake had hiddenA namedtuple
Barcelona came out as Atlantic and New York as PacificChecking the 15 major ports by handFirst match wins, boxes corrected
The detector tables stayed empty after a green run: 0 speed anomalies in 390,000 positionsRunning the model's SQL by hand found 938. An incremental cutoff of max(...) over an empty table is NULL, and x >= NULL keeps no rowA coalesce fallback in three models, and a test
A dbt task failed once, then passed on retry: Partition keys should be invariantSpark parks each task's files under _temporary/ for a few seconds, and the external tables matched /*. Reproduced 2 of 9 queriesPatterns end in partition_date=* (0 of 9 after)
Bronze wrote exactly 33 messages a second against a feed of about 95; BigQuery was 15 minutes staleThe topic offsets: the cap was 1000 rows per 30-second batch (1000 / 30)4000 by default, and a section on sizing it
A “speed 102.3 kn” sentinel produced false acceleration alertsHot path testAIS “not available” values become null

Quality

107unit tests
3Spark smoke tests
104dbt data tests
CIon every push

Verified

  • Unit tests locally and in GitHub Actions
  • Hot path and compaction on real Spark 3.5 in the project image
  • dbt parse with the same dbt version as Airflow
  • A continuous run of the live feed: 4 h 25 min, 1.26 million positions. Bronze holds every position that entered Kafka, Silver all but 26 of them, the dead-letter queue stayed empty and no job crashed once the Docker memory was sized
  • Every Airflow run since the fixes found along the way finished with all nine tasks green, and all seven gold tables are populated except the erratic-course detector

Not verified yet

  • Anything over days: the 30-day risk score, and the erratic-course detector (more than 10 sharp turns in a day), need weeks of data
  • The compaction against the real bucket (--dry-run first)
  • Exactly-once delivery: a job that dies mid-batch replays it (see the limits below)

Limits, stated plainly

Run it yourself

There is a runbook that wipes everything and starts from zero, with a check for every layer.

git clone https://github.com/TomasRipsky/marineflow
cd marineflow
python -m unittest discover -s tests     # no Docker, no cloud
# then follow FRESH_START.md

View the repository Fresh-start runbook How it is worked on